
 As I have recently written, blog spam comments could be a cool source of data to analyze, even only for fun. At first I was attracted to comment contents, but then an article on marketpress suggested me some other interesting directions to explore data and inspired me the idea to represent numerical results into interactive charts.
So, after the playful announcement of NSA analytics, I have written a basic graphic dashboard about spam comments which is a sort of spam analytics. It processes the results of some counting queries from wp_comments table in wordpress database (which, according to Akismet policy, contains the comments of the last 15 days) and chart them in three different sections:
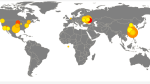
- Spam sources.Pulsing bubbles on a world map represent location and volume of spam received from the most recurring (class C masked) ip among spam comments. The bubble animation helps to prevent full overlapping of close locations.

- Spam timing. A line chart shows the volume of spam comments for each day in the last two weeks while a bar chart show it for each weekday.

- Spam destination. The most fired posts and pages are displayed in an interactive treemap. By the way, can spam volume be taken as an index of their popularity? :)

The charts above are static images but the wordpress spam analytics dedicated page reveals the real time situation. I wonder if in the near future even this page will be listed among the main spam destinations. :)
Credits. I have used Raphael and gRaphael libraries to build all the charts in the dashboard. Moreover, I was able to complete my work thanks to jqIpLocation plugin and treemap-squared script.
Go to wordpress spam analytics page.
Pingback: analisi dei commenti spam in wordpress | sei-uno-zero-nove